The 101 corridor: Transportation myopia in practice

Last week, Systemic Failure called out the Greenbrae Interchange Project as a waste of money when we already have an under-funded rail project not far away. Why spend $143 million on a road project that won’t even add capacity? While the Greenbrae project isn’t the best project, it’s about rearranging ramps, not adding capacity. While the Drunk Engineer is a great watchdog of Bay Area transportation policy, he’s looking at the wrong project. For that, we need to look a bit further north, to the billion-dollar freeway investment underway in Sonoma.

Let’s step way back to two things, money and problems, and restrict our potential solutions to roads and rail. Fresh on our desk is a dictate from The Man saying the transportation system between Windsor and Larkspur doesn’t have enough capacity to meet the demand for travel, and we have $1.4 billion ($1 billion from roads, $404 million from rail) available to fix it.

Adding two carpool lanes for the length of freeway that currently doesn’t have any will cost $1 billion, we know, and will add about 4,000 people per hour worth of capacity through the area. We can add about another 1,000 with a $500 million rail project*, but we can't afford it, so we'll truncate our line at San Rafael and Santa Rosa.

What if we pumped all $1.4 billion into the road? Lanes only have so much capacity, and that decreases as the freeways get wider. We might be able to add travel lanes at the most congested part of the road, but all the merging could just gum up the works more.

What if we flipped all $1.4 billion into rail? As it turns out, this would give us almost as much capacity.

  • Base SMART: $680 million, 650 passengers per hour (164 seats per train, 2 trains running in either direction per hour)
  • 7.5 minute service with three-car trains: $1.2 billion, 3,936 passengers per hour or 5,280 with standees**.

If SMART were to get a clearance from the FRA to run European trains, the cost of 7.5 minute service drops to $1 billion, leaving us with $400 million to spend on years of operations, grade separations from traffic, or a 10-mile extension to Richmond’s BART and Amtrak station. Success! Not only did we meet our goal, we added capacity much further north and south than the 101 project and have some money left over for other projects. That's pretty damn good.

Alas, this is not how we do things. Instead, we're spending 40% more money than we need to for a worse transportation product. That the most efficient project, SMART, cries poverty – much of its own making, true – is even more egregious. All the while, local and state authorities pump almost double the cost of the entire project for parallel road capacity. Rather than a truly transformative investment, SMART will be relegated to only a shadow of its potential.

This is the height of what Cap'n Transit calls transportation myopia, and something that happens all the time in the Bay Area. Caltrans and MTC tend to see road capacity problems as vehicle problems rather than transportation problems. When they do take transit into consideration, they just duplicate efforts in parallel to the road project because they forget that transit a means of transportation, not a goal to be achieved on its own, and functions in competition to cars. That means that nobody takes SMART seriously as transportation in its own right. Even SMART views itself as a supplement to driving.

MTC, TAM and SCTA need to cut off funding to the Highway 101 project and invest it in SMART. Caltrans is hunting for funds now, and none of these agencies should cough up the cash. Not only will the train add more capacity than the freeway, but it will also strengthen towns up and down the 101 corridor in a sustainable way, attract employers, and knit together the North Bay in a way a wider 101 never could.

We spend so much energy in the North Bay talking about the environment. Let's actually do something for the environment and save money in the process.

*The cost of the IOS + Windsor is about $500 million.

** The maximum length of a train is limited by the size of a city block to three cars, so that's how many we can put on a single train. The Sharryo train cars SMART will use have 82 seats with space for 28 standees, so a three-car train has space for 330 riders. The 7.5 minute headway is the minimum allowable without widening the Puerto Suello tunnel, and it means 8 trains per hour per direction. The cost of sidings to allow that much frequency is about $180 million more than the current system. Each Sharryo car costs $3.3 million, and 7.5 minute headways requires 34 trains. Add together the cost of 34 three-car trains and more sidings to the base cost of $680 million and you have about $1.2 billion.

UPDATE: If you're wondering where I got my costs, I detailed a double-track system here and a cheaper sidings-based system here.

GGT's bus ridership is sagging, but how to fix it?

Transit 005There’s no question about it: Golden Gate Transit ridership is in decline. But, as we cap off a year with two crazy days for transit (America’s Cup and the Giants parade), we should take a step back and look at where our ridership is going and, perhaps, how the situation might be improved.

A word about data

GGBHTD uses a July-June fiscal year, so we’ll be discussing projections for the rest of the 2013 fiscal year (last July to next June) as well as what has happened historically for the last few fiscal years. This confounds analysis. Federal data uses the federal fiscal year (October-September) while Census data uses the calendar year. If I switch into a different year, I’ll be sure to mention that in the text.

As well, it takes about one month for GGT to audit bus ridership numbers, so December’s numbers haven’t been released. Nevertheless, today seems like as good a day as any to discuss ridership.

The numbers

GGT’s ridership has been dominated by bus services for a long, long time, but its share has shrunk significantly since 2002.

In FY 2012, GGT carried 8.7 million passengers, roughly one quarter by ferry. Total ridership is down significantly from 2002, when GGT carried 10.8 million passengers – only one-sixth by ferry. All the losses have been borne by the bus segment of the system, which has seen annual declines in seven of the last ten years. In contrast, ferries have seen declines in only four of the last ten years, led by sometimes double-digit growth rates at Sausalito.

These trends look set to continue in the current fiscal year. Bus ridership for the first half of FY 2013 is down 1.6 percent over the same period in 2012, while ferry ridership is up 8 percent. Intriguingly, this could be the first fiscal year that total ridership increases entirely on the strength of the ferries.

Below is a normalized chart of ridership trends, with 2002 set as the baseline.

Transit ridership normalized to the 2002 fiscal year. Ridership for the current fiscal year is a projection.

Causes

The most obvious trend is the decline from FY 2002 to FY 2004. In that time, San Francisco was still suffering the aftershocks of the tech bubble pop, which was compounded by the 2001-2002 recession. According to the Federal Transit Administration, ridership peaked in federal year 2001 at 11.6 million transit trips – 9.7 million by bus, 1.9 million by ferry. That’s also around when bridge crossings peaked, implying overall travel demand fell.

This is borne out by census data. Since calendar year 2000, commutes by Marinites have fallen by about 6 percent. But this isn’t enough to account for the shift away from buses, which are down 32 percent. There must be structural reasons as well.

Sure enough, that’s what we find. From 2002 to 2004, GGT dramatically restructured and cut its routing to cut costs, reducing its vehicle revenue miles (how far its buses travelled collecting fares over the year) by 32 percent. Over subsequent years, revenue miles increased only 1 percent. Though GGT projected only a 15 percent passenger decline, fare increases, competition from other non-car modes of transportation like bikes and ferries, and declines in commutes, overall took a toll.

Turning the situation around

If bus ridership is going to increase again, GGBHTD needs to see itself as a single transportation agency. At the moment, bus schedules don’t link well with ferry departures, bridge tolls are too low to push people to bus usage, and timing-point schedules are hindering the development of high-frequency corridors. Most of these are actually revenue-raising measures, which could be pumped back into the bus system.

1.      Loosen restrictions on bus riders

Anyone riding Muni or AC Transit knows it is used for every errand under the sun, from commutes to groceries to getting to the airport. The front of the buses have center-facing seats reserved for seniors and the disabled, and passengers can exit out the rear door. In Muni’s case, they can enter that way, too.

Yet, for whatever reason, GGT has chosen to keep its rear-door Clipper readers deactivated, forcing everyone to exit out the front. Navigating the system with anything that can’t fit on a lap is against bus policy. As well, the lack of level-boarding buses hinders the ability of seniors from using the buses.

While the current bus configurations do keep the buses comfortable, it makes them less useful. Reforming these would make the bus more useful for everyday travel and speed boarding and alighting. Low-floor buses that provide level boarding could be the priority for all future bus acquisitions, rolling them into the regular capital replacement budget.

Cost: Marginal

2.      Coordinate ferry departures and bus arrivals

While GGT does a fantastic job timing different bus lines, it does a miserable job coordinating with ferries. Route 29 to Larkspur Landing, for example, arrives 40 minutes before the next ferry departure. Part of this is Marin Transit’s fault, which times Route 29, but GGT could easily fix the problem, too. A shuttle between the Transit Center and Larkspur Ferry, say, would encourage people to take the bus to the ferry rather than drive.

The total round trip, including layovers, would take about 25 minutes.

This leaves 20 minutes of dead time between cycles, so this service could be added on to certain Route 23 or 35 buses, rebranded as 23F or 35F, which would save costs.

Cost: $660,000 per year for new service, $340,000 for route extensions.

3.      Charge for parking at park & ride lots

I explored this concept in a previous post for ferry terminal parking, but it should apply to all park-and-ride lots that get full over the course of a typical day. This would accomplish two goals: to increase reliance on transit to get to transit, and free up spaces for midday travelers. Though some riders might abandon transit altogether, GGT would very likely see a net gain in ridership. As well, the parking fees collected could be pumped back into service, either for collector buses or for better frequency on selected corridors.

The principal barrier to implementation is Caltrans, which controls the park & ride lots along the 101 corridor. Sacramento would probably need to intervene to force them to charge and to pass the money along to GGT. The ferry terminal lots, however, are controlled by GGT and could be priced now. Ideally this would paired with the ferry shuttles described above.

Income: Variable, but likely in the low hundreds of thousands per year. Implementation would require a one-time capital investment for parking meters, ticket dispensers, etc.

4.      Increase tolls on the Golden Gate Bridge

I discussed this concept in the past as well. A driver should pay just as much to cross the bridge as a bus rider. If we raise the base FasTrak toll to $7.20 and the congestion toll to $8.80 – the cost of going to San Francisco and back from Southern and Central Marin, respectively – the bus becomes a much more attractive alternative. A commuter would pay the same no matter which mode she chooses, so why not choose a bus?

Cost: Political. Former San Rafael mayor Al Boro scuttled the last attempt at congestion pricing at the Golden Gate Bridge, and that was for a much more modest increase.

Income: Significant. When congestion pricing on the Bridge was last analyzed it was part of a broader pricing scheme that saw a 12 percent drop in traffic coming in to San Francisco from all sources. If this holds true for the Bridge on its own, toll revenues would still go up, to the tune of about $50 million per year. If any of those drivers convert to busing, the income would be even higher.

5.      Provide in-city pickup and drop-off for all-day routes in San Francisco and Richmond

It’s a bit of cheating to get numbers up, as it opens up an entirely different market, but it could provide a good source of income. In San Francisco especially, GGT provides great redundant express service. The all-day lines (basic and Route 92) could pick up riders in-city, making that part of their journey more profitable.

To do this, the boards of SFMTA and AC Transit would need to grant GGT permission to run routes through their territories.

Given how much this may slow the San Francisco routes, especially Route 92, GGT may want to wait until the Van Ness and Geary BRT corridors are completed.

Income: Unknown, but the alteration should only be made if the result would be revenue-positive.

In short, GGT should make the bus convenient (suggestion 1), easy (suggestions 2 and 5), and financially attractive (suggestions 3 and 4). It should reinvest new revenues into increased service and better infrastructure, part of a virtuous circle of rising ridership and declining congestion.

If Marin wants to be a green, environmentally-sustainable place, the bus must be part of the equation. Falling ridership isn't a given, but it will take conscious steps to bring it back in step with ferry ridership.

Grady Ranch is still a bad idea

Stop Sign Last Thursday, the IJ published an editorial defending the Grady Ranch affordable housing project from critics. If we don't know what the project will look like, asks the editorial board, how can we criticize? Perhaps it will include a bike lane and sidewalks all the way to 101. Perhaps there will be a place for Marin Transit to run a shuttle, never mind the cost. And perhaps there will be a small grocery store so residents will be able to do at least one errand without getting in the car.

While it's true that we don't know how the project will look, the arguments in defense of the project don't address the fundamental flaw of “affordable” sprawl: the burden of car-dependence on residents, and the burden of maintenance on the County.

Grady Ranch isn't “a rare opportunity to help meet Marin's need for affordable housing.” To the contrary, it would doom hundreds of low-income people to an expensive existence of car-dependance. The whole point of creating a walkable, bikeable mix of jobs and housing, which the IJ dismisses so easily, is to free people from the burden of car ownership. A car should be an option for those who want it, not a necessity for those who can't afford it. Why we would want to give our poor another burden they cannot carry is beyond me.

If car ownership will be residents' burden, services and infrastructure will be the County's. MCF, as a nonprofit, doesn't pay any taxes on any of its land or developments, meaning new residents won't have to pay. And, even if supervisors could foist the cost of extending services and infrastructure onto developers, that still leaves ongoing costs. Infrastructure needs maintenance and services have payrolls. Will Lucas, or MCF, or “possible grant providers” be willing to pay that expense for the next 50 years? Somehow, I don't think even George Lucas would be that generous.

These problems and the others I raised before need to be addressed in the first draft of the plan, not later. We cannot give MCF and Lucas “the opportunity to come up with a detailed plan before going on the attack.” Supervisors, citizens, and the two Grady Ranch partners must answer these problems now.

Besides, even if Grady Ranch is an irredeemable project, that doesn't mean the end result can't be less terrible. Given how bad the project is just on its face, we need to start to shape it before they've put time into a detailed plan. If the county pushes forward, this may be the only chance we'll get.

SMART grade crossings and congestion

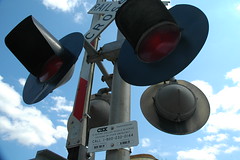
CSX Railroad Crossing Lights Some SMART opponents have been arguing that the SMART train will cause massive traffic congestion along its route whenever it closes the crossing gates.

The idea is that SMART will run most often at rush hour, when our roads are busiest, and that it would cross over some fairly busy roads at grade. The crossing gates would close for a time, backups would result, and rush hour would be ruined for everyone. This analysis deserves examination.

Federal guidelines on the subject require crossing arms to close at least 20 seconds before a train passes, and open no more than 12 seconds after the train has passed. Though most crossing arms I've seen open almost immediately after the train has passed, let's say the gate will be closed at least 32 seconds.

If a 170-foot SMART train is moving at 25 miles per hour, or 37 feet per second, it will clear a 35-foot wide intersection in less than 6 seconds. If it's slowing to a stop, such as around Fourth Street in San Rafael, it might travel at about a fifth that speed, and will cross the same intersection in 28 seconds. SMART's design documents say it will run at the same speed as parallel streets, so these are reasonable speeds to assume. Added these times to the minimum closure time and we find a maximum an approximate wait delay of 60 seconds, roughly the same amount of time as a normal traffic light. Thanks to long headways, each grade crossing will have to endure, at most, 60 seconds of delay twice four times per hour.

In the populated areas SMART will cross through, the crossing arms will communicate with with the rest of the traffic light system. That will further minimize the effect of the train's activities on local traffic flow.

It seems, then, that the concern is overheated. While freight trains extending thousands of feet in length would cause major congestion, the relatively short SMART trains will be speedy enough so as not to cause a problem. With intelligent traffic engineering, they won't be any more of a pain than traffic lights are now.

This post has been updated for clarity.

Given last week's post about Grady Ranch, it might be good to have a refresher on just how expensive car commuting actually is. A bit over a year ago I posted this piece on the aggregate cost of driving alone to work, and it bears repeating.

Why cyclists need police understanding, not crackdowns

Kelly O'Mara granted permission to re-post her op-ed on the interplay between bikes and law enforcement. If you've ever ridden a bicycle, it rings true.

----------------------------

Earlier this summer, a number of local police jurisdictions had big crackdowns on cyclists. It was supposed to be a targeted enforcement on lawbreakers on two wheels. Some police departments even focused just on cyclists for a couple weekends.

For a number of reasons — the targeting of a specific segment of the population and the ongoing hostilities towards a group of people on the road who are more vulnerable than others — this really seemed wrong.

I wrote an op-ed about it at the time, which was supposed to run in the paper. But, there were some disagreements.

So, I’m posting it here:

We have a lot of laws. We have laws about not driving while holding pets. We have laws about crossing the street in crosswalks. We even have laws banning smoking at bus stops, which are widely ignored.

What laws we choose to prioritize or actively enforce reflect our choices as a community. While immigrating to the U.S. without proper paperwork may be illegal, regular raids in Marin would likely cause an outcry against the ugly racism inherent in those enforcement policies.

When multiple police agencies in the county make it a public priority to target cyclists, it reflects no different an ugly bias.

It has been argued that Fairfax, San Anselmo, and Sausalito’s decisions to crackdown on cyclists doesn’t target cyclists but only lawbreakers. If that were true, then it would have been publicly announced as a crackdown on all traffic infractions. In fact, it was just the opposite. San Anselmo’s traffic enforcement division focused solely on cyclists one weekend. Evidently, leaving drivers free to do whatever they wanted.

Yes, I bike. I also drive. I even walk.

And, I understand how annoying a group of cyclists racing through town can be. But, the obsessive focus on cyclists coming to a complete stop at every sign, even if no one’s around, is a red herring issue.

We continue to insist on ‘separate but equal’ treatment, repeating that bikes must follow the exact same rules as cars, instead of acknowledging they are different vehicles with different expectations. Truly following the exact same rules on a bike would get you killed and hold up a lot of traffic. Let’s not lose sight of the intent of our laws: to make roads safer for everyone.

There are around 700 cyclist deaths every year. There are over 50,000 injuries. Yes, some of those accidents are caused by cyclists not stopping at stop signs. But, most are caused by simple misunderstandings between cyclists and drivers or by a lack of awareness or by blatant hostility that leaves someone blacked out after a hit-and-run.

Most accidents are caused by an attitude that treats a segment of the population as second-class citizens and targets them based on how they look.

Nearly every cyclist, particularly if they wear spandex, has been sworn at, called names, forced off the road, or been in a crash because a driver didn’t see them or didn’t think they deserved to be there – as if driving to ride a stationary bike at the gym is somehow more worthwhile. Hit-and-run accidents in West Marin are not uncommon and, often, the police either can’t or won’t do anything. Many cyclists who find themselves in the hospital are then faced with another battle that, to the best of my knowledge, has never ended with a driver being charged with anything in Marin.

I hear over and over that cyclists are arrogant and entitled. But, many are just frustrated.

When our police make it a priority to target cyclists they teach the community that it’s ok to target cyclists. When it becomes official policy to go after a segment of the population, it implicitly condones hatred of that segment. In this case, that makes drivers more likely to view cyclists as an annoyance and more likely to take an attitude that puts those cyclists in harm’s way – cyclists who now, more than ever, feel they will not have the support of the very people who are sworn to protect them.

When our police agencies make it a priority to target just cyclists, instead of everyone who make the roads unsafe, it makes the road a dangerous place.

This post originally appeared on Kelly's blog about just about everything, Almost as Good as TV. She is a freelance writer living in Marin County.

Tam Junction Isn't Going Anywhere

There is a lot of heartburn around Tam Junction. Development, they say, is coming, development that will be ruinous to the neighborhood and anyone who moves into new homes. What’s actually going on? As it turns out, a whole lot less than imagined.

Background

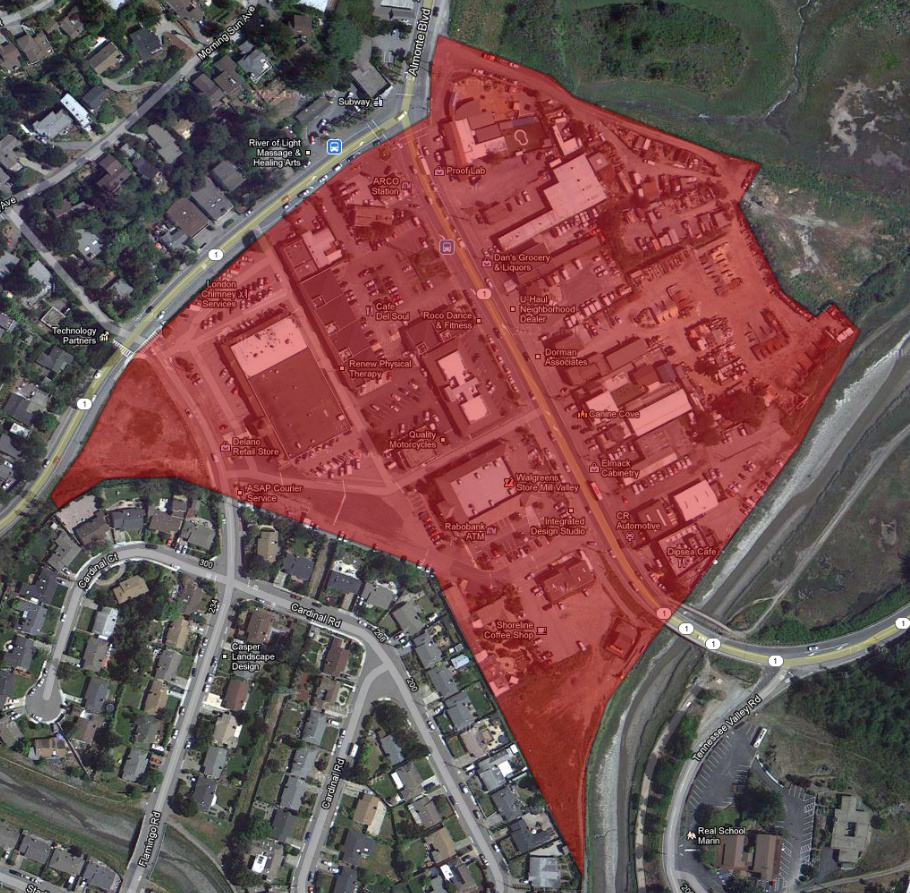
Tam Junction. Click for Google Maps

Tam Junction is a 20-acre commercial strip wedged between Tam Valley and Almonte. It used to be the junction of the Interurban’s Mill Valley Line and their main lines to Central Marin, hence the name. Now, it’s the intersection of Highway 1 (aka Shoreline Highway) and Almonte Boulevard, and getting through there is suitably difficult.

Though I haven’t been able to corroborate the grade, Sustainable TamAlmonte says the intersection has a Level of Service grade of F, meaning it’s over-capacity. There’s a push in Caltrans and among neighbors to make the whole area more pedestrian and bicycle-friendly, which should take some pressure off the roads, but overall it is just a difficult intersection to traverse.

Tam Junction itself is built on flat, muddy soil, the kind that’s prone to liquefaction during an earthquake. Safe building standards, then, requires some serious reinforcement to bedrock. It’s a dusty, ugly, and semi-industrial bit of the county surrounded by some absolutely stunning scenery and some fairly charming homes.

The zoning for the strip is commercial, but it allows an FAR of 0.4, at most, and has a height limit of 30 feet. This means that it can only have 40 percent the square footage as the size of the lot – a 1000-square-foot lot could have only a 400-square-foot building, which itself can only be 30 feet tall. The northeast bit is part of the Baylands Corridor, a special protected area in the county’s General Plan that can’t be easily built upon.

What’s going on?

Tam Junction has been marked as a Project/Priority Development Area, also known as a PDA. This designation allows it to get additional funds for transportation infrastructure improvements, which it definitely needs. One Bay Area established the PDAs to help focus funding to areas that counties or cities deemed to be particularly worthwhile investments.

A common understanding is that a PDA designation is actually to focus housing development, but that’s not always the case. In essence, the purpose of a PDA is to align the transportation infrastructure with housing. That means either investing in housing development if the infrastructure is underutilized, or investing in infrastructure if what’s already there is over-capacity. Tam Junction falls mostly into the latter category.

I say “mostly” because the Marin’s state-mandated housing element points out six sites in Tam Junction that could be used for affordable housing development. These sites will in all likelihood never be developed: the high cost of construction in Tam Junction’s mud, not to mention the incredibly constrained building envelope, would scare away for-profit and non-profit developers alike. They’d be much more likely to invest in Sausalito, Miller Avenue, or San Rafael than in Tam Junction. The six sites point out the possibility of rezoning those areas to moderate densities but do not guarantee any development.

It’s important to point out that any development that would occur would not be out of character for area – 268-274 Shoreline Drive is a small strip of 30 unit-per-acre density, and Tam Junction already plays host to 30-foot-tall buildings.

Oppositional dissonance

In one sense, it’s a bit of a shame nothing would be built in the area. Sustainable TamAlmonte, a local group, strenuously opposes any residential development in the area while supporting any commercial development. Yet residents now can’t support more retail than is already there. If they could, someone would have taken over the psychic’s shop and opened something with a bit more pizzazz. The strip would need more residents to become a viable retail center. It can’t just become downtown Mill Valley because residents want it to be; it needs actual shoppers with actual money, and housing development would provide a way to do that without generating much traffic, as most new shoppers would be able to walk to their store of choice.

The other option would be to attract more shoppers from elsewhere in Marin, poaching some business from Sausalito and Mill Valley. Yet this option would attract even more traffic to the congested area, rendering it even more dangerous for residents walking, biking, driving, or simply living in the area. I hope Sustainable TamAlmonte isn’t suggesting this sort of development.

In sum, Tam Junction isn’t likely to change much more over the next decade than it has in the last decade. The barriers to development – namely mud and zoning – will make it difficult to do anything other than improve the existing infrastructure for existing residents and businesses. Given the harrowing testimonies of advocates at the last TAM meeting, that should be change enough.

San Rafael Bikeway under official consideration... in San Anselmo

Long-time readers of The Greater Marin will likely remember my proposal for a protected/Class I bike lane through downtown San Rafael. I hoped the San Rafael Bikeway would spark some discussion about integrating bicycling infrastructure into the primary arteries of Central Marin, and I got a bit of positive response from the blog but not much officially.

Now, the San Anselmo Quality of Life Commission has taken up my proposal and could endorse it at tonight's meeting, which would be a first step to making the Bikeway a reality.

The San Anselmo Quality of Life Commission doesn't have much pull on San Rafael policy, but the work of the commission is taken seriously by the San Anselmo Council. An endorsement by the town council would be a next step, and I'll be lobbying for it when I'm in town for the holidays.

So consider this an action alert. Though I sadly won't be able to attend and advocate on behalf of the Bikeway plan, I've submitted a letter urging the commission to adopt the resolution, and a show of support would be most appreciated.

The San Rafael segment of the East-West Bicycle Plan is woefully inadequate, forcing cyclists far from downtown so as to avoid Third and Second. The San Rafael Bikeway would not take away any traffic lanes during commute hours. It would spur far more bicycling along the whole corridor - studies have shown that protected bicycle lanes double the number of cyclists along a given corridor - and would help support downtown business.

Since residents of San Anselmo would be just as likely to use the Bikeway as the people of San Rafael, the quality of life in San Anselmo is very much tied to how San Rafael designs its infrastructure. Show your support, and tell the commission to vote yes tomorrow.

What: San Anselmo Quality of Life Commission meeting When: 7pm, Monday, November 19 Where: San Anselmo Historical Museum, 525 San Anselmo Ave., San Anselmo Agenda: Here Plans: The San Rafael Bikeway Proposal

It's Policy, Not Preference, that Shapes Cities

Baltimore [Population: 288,530,000]People keep writing about the effectof our urban policies, but very few outside the urbanist blogosphere write about the policies themselves. The articles that result satisfy our curiosity about change but fail to actually inform. They’re all candy, no vegetable. Two articles published last week exemplify this trend. Both describe the effects of the same policies, but both fail to discuss the policies themselves. The New York Times profiled the blighted rail corridor between New York City and Washington, DC. If you ever travel that stretch of rail, you’ll see boarded up homes, weedy back yards, abandoned factories, and the detritus of a country that’s moved on from its industrial past. In its place has arisen an incestuous service economy built by a New York-Washington axis of power. Anyone with any money has moved to the ‘burbs, leaving the cities behind to rot. At least, that's what the Times' Adam Davidson says.

Meanwhile, Meredith Galante, writing in Business Insider, wrote glowingly of micro-apartments, tiny homes 160 to 300 square feet. These, it's thought, will help solve the housing crunch in major cities as people flock to city centers and drive rents to the stratosphere. Such homes, according to one entrepreneur, are the future in increasingly overcrowded urban areas.

Wait a second. Anyone with money has moved to the ‘burbs but people with money are so desperate to live in cities that tiny, expensive apartments make sense? Both explanations can’t be right, but both trends are happening anyway. What gives?

Suburbanization, and the policies that encourage it outside and within cities, is to blame. The layers of regulation banning increasing density; the hundreds of billions invested in roads to speed suburbanites into the city in cars; the parking lots to store all those cars that destroyed buildings and the city’s fabric; and the zoning codes that locked uses into place have released bizarre forces on cities. Where suburbanization has been restrained, city living is so valuable but so difficult to accommodate that housing is squeezed into every nook and cranny of developable space, and there's not a lot of that. Where suburbanization runs rampant, cities collapse under the weight of regulation and outright destruction.

Micro-apartments in the Boom Towns

Zoning, that can be the most destructive by banning reinvention of place. Regulations dictate exactly what kind of building can be built, how many people can live there, what kind of business you can open, how many parking space you must have, how far back the building must be from the property lines, and on and on.

To amend the zoning code requires going through homeowners zealously protective of the status quo. Consideration of legalizing in-law units incites howls of protest that such plans would destroy the neighborhood. Even in New York, the idea of allowing taller buildings in Midtown Manhattan has caused consternation and hand-wringing over whether they would, yes, destroy the neighborhood.

It wasn’t always so. In the 1910s, Manhattan’s West Side was all mansions; by the 1930s, it was apartment blocks. The wealthy had found other places to put mansions, and the city was growing so rapidly that allowing one family to occupy a half-acre of land was unacceptably expensive. Putting a hundred families in its place ensured that new housing satisfied the extremely high demand. Apartments along San Rafael’s D Street are the result of the same process. Sprinkled among single-family homes, the apartment buildings provide valuable housing for those who want to live close to Marin’s urban heart.

Now, the places where development can happen become ever more rare, and stiff design review processes ensure that it will take huge sums of money and sometimes years to pass just one project. It’s no wonder there’s a housing shortage - we have the political brakes on so hard we can't move anywhere near fast enough. Micro-apartments, which allow the most units to be squeezed into the city's apartment production line, are the inevitable result of supply constrained on every side.

Cities We Leave Behind (Every Day)

In the blighted cities described by the Times, policies designed to facilitate the suburbs accelerated declines from prominence. Loans and tax deductions favored single-family homes, single-use zoning isolated residences from business from office, and superhighways encouraged anyone with money to leave cities behind. It didn't help that those superhighways destroyed huge swathes of cities and shut out downtowns from the nearby neighborhoods.

The trigger for the exodus in many of the cities between Washington and New York were race riots in the 1960s. Angry mobs tore through businesses and destroyed the livelihoods of millions. Even DC was not immune; the current population boom mostly involves repopulating the burned-over areas that had rotted for decades. New freeways built over the poorest neighborhoods whisked people between their new homes in the ‘burbs and their old jobs in ossified office districts, zoned and reserved for the needs of car-based office workers. Even today, those workers leave their cities behind to fend for themselves on a daily basis.

Now that we want to reinvest in our center cities, the priorities of the car-driving suburbanite still take precedence. Requiring developers to build a certain amount of parking spaces, for example, is extremely common in American cities. Unfortunately, the practice has little basis in science and does quite a bit of harm. It reduces the viability of projects by forcing the construction of excess spaces, hurts the streetscape by putting more cars on the road and lining sidewalks with parking rather than retail. At the very least it means investments in on-street bicycling are rejected because of reductions in on-street parking or in the number of lanes on a street. Dedicated transit lanes and freeway demolitions are often rejected for the same reason.

Yet this is The Greater Marin, a blog about a suburb, and it may seem out of step to advocate for keeping Marin’s low-rise towns while excoriating cities for bowing to the needs of the people that live in those low-rise towns. I don’t think it is.

Novato has zoning rules that ban banks from facing Grant Avenue, forcing the new Umpqua Bank branch to face a parking lot instead of the sidewalk. San Anselmo's zoning bans bike shops from San Anselmo Avenue, though clearly the rule is happily ignored. San Rafael forces downtown residences to build parking on-site while city-owned parking garages sit half-empty. These restrictions hurt our towns, businesses, and both current and potential residents. It’s not just the big cities that are hurt by unexamined rules; we are, too.

When articles tout micro-apartments as the Next Big Thing or bemoan the decline of the industrial city without a policy discussion, they do a disservice. They gloss over the causes that created and perpetuate these trends, providing easy answers in place of honest critique. It wasn't just industrial decline that wrecked the cities of the Northeast; suburbanization did. It's not that young people want to live in tiny apartments; zoning forces them to trade living space for location. Avoiding discussions like this is bad for San Francisco, bad for the Northeast, and, ultimately, bad for Marin. The Times and Business Insider should know better.

Changing Demographics Calls for Changing Housing

Discussions of Marin’s development often lack data but are long on anecdote and impressions, giving misguided assertions about Marin's population or housing undue cachet. But if Marin wants to genuinely plan for the future, it must face the facts of its people and its housing market: there is strong demand for larger apartments in Southern Marin and smaller apartments elsewhere; there are more kids and more people living alone; and that the graying population will need to be able to downsize.

Graying Needs

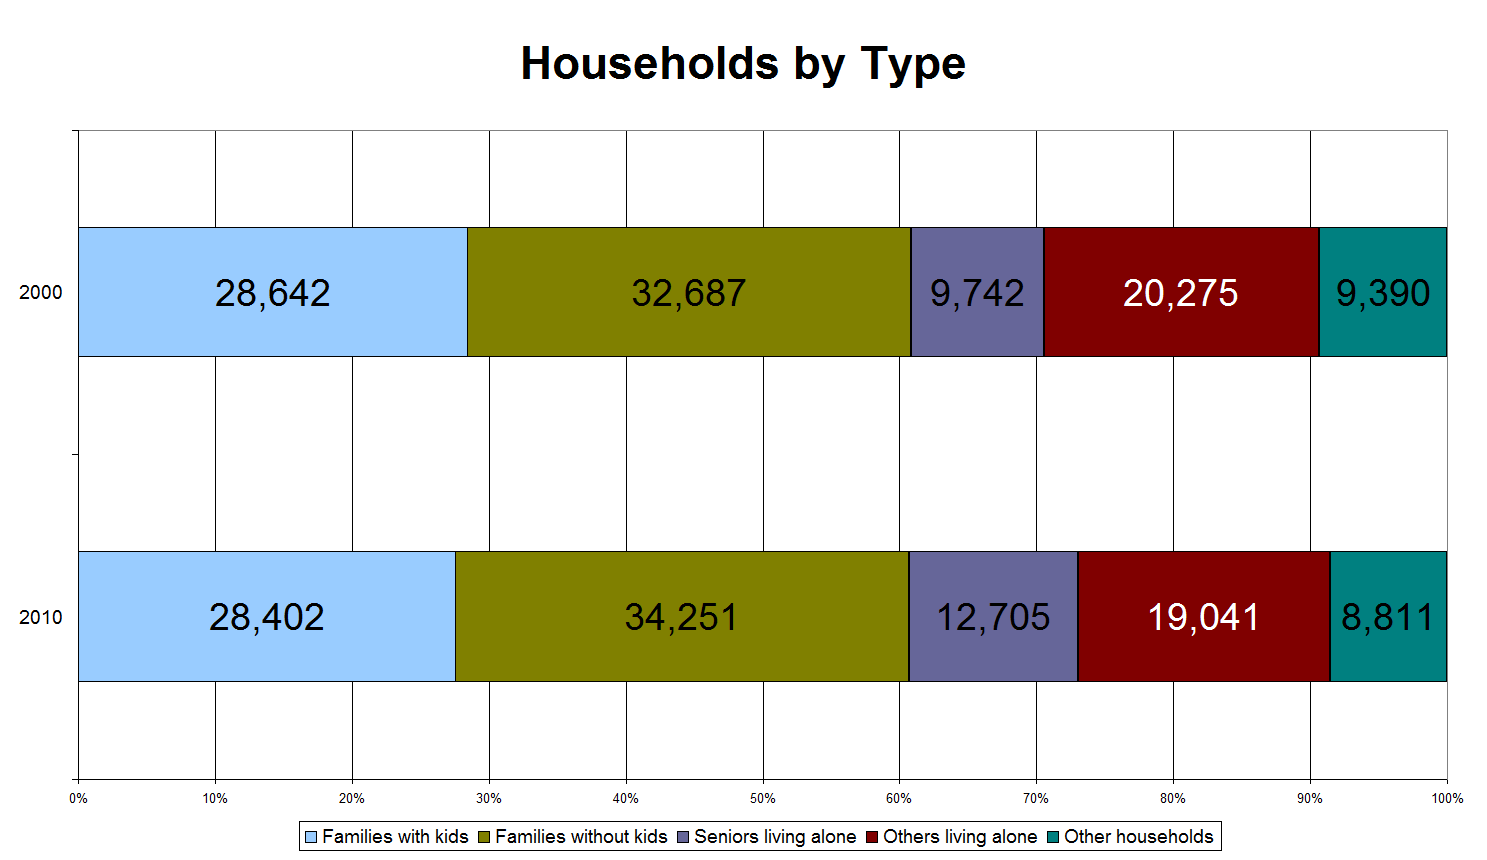
Between the 2000 and the 2010 Census, Marin’s population grew by about 2 percent and its median age increased three years, from 41.3 years old to 44.5. While the proportion of school-aged children increased by about 1 point, the proportion of middle-aged people plummeted by 10 points; those aged 55 and up increased by a similar amount. So, while we got older, our families grew a bit.

And though our average household got a bit larger, the number of people living alone, especially seniors has already started to increase faster than the population as a whole, while the proportion of families has actually gone down.

The shift is divergent between Southern Marin and the rest of the county. While the median age of Southern Marin has kept pace with the rest of the county, it's been attracting families. The number of people living alone actually declined by 2.5 percent in Southern Marin while it jumped 9.4 percent everywhere else. The population of elementary-aged kids positively boomed, growing an astounding 17.3 percent while the rest of the county’s population shrank by 1.1 percent.

Yet even here, the continued shift to older individuals means its familial boom can’t continue without seniors leaving the region. Southern Marin is where the families are going, it’s true, but it’s aging just as quickly. Unless those seniors start to leave or new family housing is built in Southern Marin, housing costs are going to continue to climb into the stratosphere.

As this shift away from families and towards empty-nesters goes on, people will increasingly use family-sized homes for couples and singles. Already we have 1.17 bedrooms per person compared to 0.95 for the state and 1.15 for the country at large.  If we want to keep our homes turning over while keeping our long-term residents in town, we need to allow space for people to downsize into. Senior housing, small single-family homes and the like would allow people to transition without leaving out of the county. Building such homes near transit would give seniors flexibility once it’s no longer feasible to drive, incidentally a goal of AARP.

Squeezing the Market

Rents reflect the shifting demands in Marin's largely stagnant market. The average rent for a three bedroom apartment has skyrocketed in Southern Marin, moving up 28 percent to $3,232 in just a year, from the first quarter of 2011 and now.  Studio rents there have stayed fairly steady, increasing only 4 percent in the same time period. In Central Marin, however, studios and two-bedroom apartments have dominated the market's rise, with average rent increasing by 14 percent and 17 percent, respectively.

The housing supply has left behind the studio apartment. Marin has been upsizing, replacing small homes for large ones: the number of no- or one-bedroom homes has dropped 19 percent while larger homes have increased 11.9 percent. It means there will quickly be a shortage of studio and one-bedroom apartments, and there's no relief on its way.

Zoning codes currently in force actually punish developers for building small units. Density limits on a per-unit basis encourage developers to build the largest units that can be rented rather than the most rentable mix of units. Other limits, such as maximum floor area or parking minimums, further strains a developer’s capability to build small. ABAG density guidelines only make the problem worse by politicizing density over height, inspiring impassioned speeches against zoning 31 units per acre.

In Southern Marin, where high rents should bring more development, community backlash against any and all development has had a major chilling effect. Who would buy developable land when they see the nightmare faced by the Blithedale Terrace? Those high rents for three bedroom apartments are the result of a major housing shortage. Shockingly, they’re actually approaching the cost of studio apartments on a square-foot basis, something unheard of except in extremely constrained and warped markets.

Bottom Lines

If Marin wants to continue to be a place for families and its seniors, it must move away from density limits and allow the market to adjust. San Rafael is already doing this with the Downtown Station Area Plan, which maintains height limits but abolishes density limits. Southern Marin could get a boost from the Mill Valley General Plan update if it’s paired with permitting process reform.

Marin can’t be held in stasis; its housing supply is built for an increasingly small demographic – the home-owning family – leaving the childless, seniors, and renting families to compete with extraordinarily high prices. If Marin tries to steer clear of infill development it will only shut out all but the wealthiest of new residents and those lucky enough to get a spot in affordable housing. We’ll be forced to build nonprofit housing, burdening municipal and county budgets with people who need services but whose homes are exempt from property and parcel taxes. Marin is changing, and our governments and residents need to let our housing supply do the same.

Shootings are Second to Crashes

More police have been killed by cars over the past decade than have been shot. In fact, the number one cop-killer in the US is the car, not the gun. Add in motorcycle crashes and its more than all violent deaths combined. Transit Miami, in an article about public apathy over traffic deaths, found a table with the causes of police officer death as collected by the National Law Enforcement Officers Memorial Fund over the past 10 years. Nationally, 173 officers have died nonviolently, such as a job-related illness, 650 officers have been killed violently, and 687 have been killed in traffic.

Think about that. More cops die on the road than die in the street.

People fixate on the violent deaths and try to prevent those, but pay little heed to traffic fatalities. A quick search of Google trends data finds peaks about officers shot or killed. Only one article, from Maryland, was about an officer killed in a car crash, but it’s a memorial piece. There’s talk about the dangers police face every day, but, just like when a civilian dies, traffic deaths are taken as inevitable.

They’re not inevitable. Simple things, easy things, can make police officers and civilians safer when travelling. Road safety isn’t as sexy as bulletproof vests or Tasers, but it’s the difference between life and death for those who have pledged to serve and protect the public. We owe it to them, and ourselves, to never forget that it's roads, not just guns, that kill.

Alternative Future: A Contemporary Interurban

Let's say for a minute the Interurban hadn't stopped running in 1941. It was bleeding money, but its parent company, NWP, was a for-profit entity. What if the Interurban had somehow survived?

For the sake of this exercise, I'm taking a few liberties. First, that the Bay Area had valued its rail transportation system from the 30s to the present, but had consolidated it all, as well as the Golden Gate Bridge, under the single umbrella of the MTC. Second, that European best practices had been implemented at least in this corner of the country. Third, that the Interurban could now survive on a 50% subsidy. And fourth, that Marin and Sonoma have their current populations, though with less sprawl.

Though I had originally intended for this to be a bit more a light post rather than something more data-driven, a Twitter conversation with Dan Lyke motivated me to put some numbers behind the costs of an Interurban.

Costs per vehicle-kilometer (vkm) vary widely based on the system. Vancouver's automated Skytrain system costs $2.18/vkm, BART costs around $3.50/vkm, and New York's subway costs $5.81/vkm. Using quite a few assumptions, I get an average annual operating cost between $43.2 million and $111.6 million. If we assume an average fare of $2.50 and a 50% farebox recovery rate, total ridership would need to be between 8.6 million per year, roughly the same number of transit trips on today's GGT system, and 22.3 million. With the Geary and North Beach extensions (Muni's 38-Geary alone carries over 13 million weekday passengers per year), it's entirely feasible for the system to meet BART's 80% farebox recovery.

Alas, reconstructing the system would be prohibitively expensive and politically impossible. Large portions of some major roads (Sir Francis Drake Boulevard, Fourth and Third Streets, Magnolia Avenue, Miller Avenue, and others) would need to be converted back to rail, wealthy homeowners would need to accept trains running behind their back yards, Sausalito would need to take a new elevated railway along the waterfront, Geary and North Beach would need to be torn up for a new subway, and over $10 billion would need to be spent. While the San Francisco part of the project might be worth it, for 8 million riders per year, most of them already served by transit, the cost and pain of the Marin Interurban simply wouldn't be worth it.

This map, along with all my other maps, is posted in the Map Room.

Mapping the Interurban

In 1941, the last ferry and the last train ran on the NWP Interurban commuter line, and Marin was handed over to the battle of its life against the car-centric development unleashed by the Golden Gate Bridge. Marinites, unlike most of the country, won that battle, and we maintained the transit-oriented development passed down from the age of rail. Most of us, though, don't even know what it looked like, and the best thing we've got are grainy maps and schedules from the 1930s. That's all well and good, but hides the structure and sinews of the system. The purpose of contemporary transit mapping is to combine not just where a system goes, but how and, to a lesser extent, when.

I've created two maps that do just that for the Interurban. The first is in an "old" style. Old printing techniques could only print two or three colors. Given that the Interurban shut down in 1941, I thought a map inspired by that era made sense.

The second map is the same thing, but in a "new" style. With contemporary printing techniques, we can do as many colors as we like. The advantage is that individual lines can be individually colored, snapping into focus what lines go where.

As you can see, it was quite a comprehensive system, at least for Central and Southern Marin. Northern Marin was served by intercity rail, more akin to Amtrak than BART, and was not part of the electric rail system highlighted here.

It's Our Infrastructure that Kills Us

When a car and a person collide, survival is all about speed. Almost everyone survives getting hit by a car going 20 miles per hour; at 30, survival is a bit better than a coin toss at 55 percent. Only 15 percent of people survive a crash at 40 miles per hour. Novato’s main roads are legally limited to 35 miles per hour but, given a comfortable five mile per hour margin, are effectively 40 mile per hour zones. In some places, the lanes are as wide as those on a freeway, giving the illusion of safety at 50 or 55. Novato is a dangerous place to be a pedestrian, and it’s dangerous by design.

Last Thursday, Hailey Ratliff was riding her bike home from her new middle school. A recent transplant to Marin, the seventh grader was settling in well, and it seemed like the move would be a success.

Elsewhere in the United States, the ability to ride a bike home from school is a rare privilege. Many new schools are built with only the car in mind, along wide roads that lack sidewalks, let alone crosswalks or bicycle lanes. Only 15% of American children walk or bike to school, down dramatically from even 20 years ago when half could get themselves to and from their classes.

As she was on her way home, someone else was driving into town on Novato Boulevard. As the road winds through rural Novato and West Marin, cars can speed along at 50 or 55 miles per hour, an easy five or 10 miles per hour above the posted speed limit but we typically concern ourselves with.

As the driver would have just started to slow down for the first stop sign that marks the entrance to Novato, Hailey somehow got in the driver’s path. The SUV struck her with such force it left Hailey’s helmet and shoes in the road and threw the bike back into a telephone pole.

The road where the two collided is actually wider than the rural road just before. Drivers respond to visual cues better than posted speed signs to determine a “safe” speed. We all know what it’s like to feel like we’re driving safely, only to be pulled over for speeding. The new tunnel for Doyle Drive is an example – its wide lanes and easy curves are at odds with the 35 MPH posted speed limit. Where Hailey was hit, the eastbound lane effectively widens to 15 feet as the paint delineating the shoulder is almost worn away. The center turn lane that suddenly appears makes passing cars feel like they aren’t going so fast, giving the illusion that it’s safe to drive even faster than before. Though the speed limit drops to 35 normally and 25 during school hours, that road is built for 50.

So while the collision between Hailey and that driver was probably the result of inattention by one or both of them, it was the speed that killed Hailey Ratliff, a speed that we normally shrug our shoulders about. It’s a speed that Novato encourages through roads designed for cars, not people. Hailey should be alive today, but the negligence and auto-oriented myopia of Novato’s planners made that road entirely unsafe. It’s our infrastructure that killed Hailey Ratliff, and it will keep on killing us until we say enough.

New Visual of Highway 101 Service

Marin’s bus service is centered around Highway 101 and its “trunk” routes. From commuter lines to the basic San Francisco regional lines to the supplementary local routes, getting from one place to another on Highway 101 should be an easy task. Alas, it is not. Not every bus pad is labeled on the freeway bus map with which buses stop where. Since not all buses stop at all bus pads, you don’t always know whether to take the bus or not. The first time I went by bus to the Lucas Valley pad on a Sunday morning, I tried to figure out which buses stopped there and would pick me up at the Transit Center. Not knowing that it was all printed in the front of my transit guide, I took the 49K and went on a long, 35-minute ride around Terra Linda. Had all the information been in front of me at once on a simple map, I would’ve known that the 70 and 80 would’ve taken me, no problem, but that I should avoid the 101.

The bus map here is a strip map, a simplified diagram showing all stops and which buses stop and which stop when. Though it’s a design that could be improved upon, the map does show all routes and all stops along the 101 corridor. Ideally, the map would be paired with a Highway 101 timetable showing all bus departures. It and the schedule would be posted at every bus pad and major transit hub on the corridor, allowing every passenger to know which bus goes where.

At 41 inches long but only 10 inches wide, it could also be posted inside buses that run along the 101 corridor, allowing passengers to look at it and internalize it while riding, like how subway cars have a map of the subway posted.

Since this is a rather complicated trunk line, be sure to post corrections and comments for me. How, too, could this design be improved upon? What might make this a less confusing or more useful diagram?

On another topic, be sure to come out this Wednesday to the Flatiron, 724 B Street, San Rafael, CA, at 6pm for our third happy hour. It’ll be good times, I guarantee it.

UPDATE: I neglected to mention that Anthony Nachor of My Bay Area Ideas was instrumental in proofing things. He knows the 101 system like the back of his hand, so a hat tip to him for his help.

GGT's Offer Is Good, but Leaving Ain't Bad

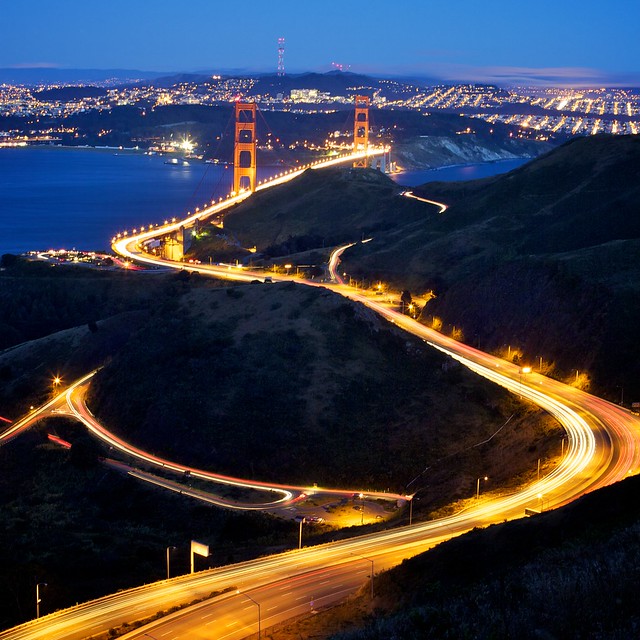
Golden Gate Bridge from Coastal Ridge Trail The impending contract vote by Marin Transit later today is extremely important to the future of transit in Marin and Sonoma. Though the final contract offer by GGT is far from perfect, its upsides are greater than its downsides, and is on balance a better deal than splitting Marin's transit offerings even more.

If you haven't been following the saga, Marin Transit (MT) is currently renegotiating its ongoing contract with Golden Gate Transit (GGT). GGT provides local bus service for MT, and MT tell it where to go and pays for it. GGT also provides regional service to San Francisco and the East Bay, operating the commuter routes as well as routes 40, 42, 70, 80, 101, and 101X. However, GGT's current contract is inflexible and expensive. It's inflexible, in that MT needs to notify GGT of service changes more than a year in advance, meaning routes that MT has marked for change won't see change for far longer than even the decision-making process.

The cost to operate one bus for one hour, known as a revenue-hour, is $133, and that cost increases by 5% each year. This price is greater than and increases faster than comparable providers in other regions and even around the Bay Area. MT thinks it can get service for $120 per revenue hour or less.

The cost issue is what prompted the current negotiations. MT is projected to be out of money in less than five years unless its cost structure changes. With an already-expensive service steadily increasing in cost, the current system just isn't sustainable.

The New Contract

Thankfully, nobody wants to keep the current system. While a TAM study showed that cost savings could be realized by switching to another vendor, keeping the two systems together is about cooperation as much as it is about money. With that in mind, GGT gave its final offer to the negotiating team, and it looks like a pretty good deal.

In short, for a 25% reduction in revenue hours, GGT is willing to cut its cost to $120 per revenue hour and cut its annual increase to 2.7%. The revenue hour reduction would give MT the responsibility of finding a new vendor for school service, Routes 19 and 51, and a few hours on Routes 23 and 29, likely the school day service on the former and the Fairfax service on the latter.

The reduction in hours makes a lot of sense. Currently, school service is provided by GGT, but it really doesn't need to be. School buses, while they do have high ridership, are extremely inefficient. They're like commuter service but with a much tighter window of arrival and departure to coincide with school's beginning and ending. It provides a good service, but it's not general transit, which is where MT should be focusing its resources. Finding a cheaper vendor would allow them to do so.

Routes 19 and 51 are slated for changes to their service that will take more than a year to implement under the current contract. By turning over control of the two routes to MT, the service changes can come into effect immediately, benefiting riders in Tiburon and Novato and saving MT money that will come with the improved efficiencies.

The cost cuts, meanwhile, are wonderful news. Though it's unclear whether this increase is before or after inflation, it is a low number either way. Other transit agencies in the Bay Area have seen their costs spike for reasons ranging from pensions to fuel prices. Having costs remain steady and, indeed, below that of comparable agencies, is a fantastic deal for MT and makes planning service changes into the future significantly easier. It also means that, though $120/hour is more than the average for the region, it will increase more slowly and so will not remain above average forever.

But if MT does pursue other options, it won't be the end of the world for the agency. More money will be available to expand local transit options, and scheduling contacts will likely remain intact. GGT could focus on its core mission of providing regional service to the North Bay, while MT could focus on its core to provide regional service to Marin. In the end, Marin's transit network would look more like Sonoma's, with its overlapping service, and less like San Francisco's, with its unified Muni network. Though I'd rather see the latter than the former, with cooperation and leadership even fractured networks can be fruitful.

MT General Manager David Rzepinski thinks this GGT's final offer is the right one to take for his agency and the county, and I'm inclined to agree. If MT dumps GGT, that will add what looks like a third transit agency to Marin (MT, Stagecoach, and GGT), and SMART will make four. Such fragmentation would be bad for Marin and bad for the region, putting lines between services that ought not be there.

In the end, MT should take the deal from GGT. They're expensive but provide top-quality service and seamless integration with MT's local routes. Lowering the cost per revenue hour makes it affordable, and lowering the rate of cost growth makes it affordable for the future as well. The MT meeting starts at 10am.

UPDATE: Marin Transit unanimously approved the four-year contract, calling it a stop-gap measure. It plans to revisit the contract in two years.

GGT Seeks Bike Racks, Signage

Golden Gate Transit wants to get Larkspur Landing and the Bettini Transit Center in downtown San Rafael new bike racks and new signage, indicating the agency is serious about integrating its system with the region’s, and understands that burgeoning bicycle usage is good for business. The request for bids (PDF) went up on GGT’s website two weeks ago and, though it’s always questionable if there will be any acceptable bids, it’s an exciting development.

Bettini Bike Racks

The Transit Center has 41 bicycle parking spaces at the moment. Though at the edge of a rather bicycle-unfriendly district of the city, the spaces fill up often. Google Streetview shows bicycles locked to poles and signs, and I’ve seen more bikes locked to fences under the freeway. Clearly, there is a need.

In response, the transit agency wants to install 25 new spaces using Dero double-sided campus racks scattered around the platforms. It’s unfortunate that none of these racks will be covered. Bicycle handles and seats will bake in the summer and get soggy in the winter, which can mean an uncomfortable ride home after work. On the other hand, most bicyclists who don’t mind riding down Fourth Street – or, God forbid, those traffic sewers charitably known as Second and Third Streets – can probably deal with some heat or wet. Besides, the Transit Center was built without much regard for bicycle parking in the first place. There just isn’t a whole lot of space under the rooftops.

Larkspur Landing Bike Racks

Larkspur Landing has 71 bike parking spaces – 60 outside the fare-restricted waiting area and a paltry 11 inside. GGT wants to replace the planter boxes lining some of the waiting area with 56 new bicycle spaces. The racks will be Peak Racks' single-sided campus racks.

Given the crunch of access to Larkspur Landing, this makes a great deal of sense. For whatever reason, neither Marin Transit nor Golden Gate Transit have made Larkspur Landing bus service a priority, though this will change with the Greenbrae Interchange Project. Parking is at its limit, too, and unless there's space to either take bicycles to the city or lock them at the terminal people will choose to drive instead.

Signage

Both the Transit Center and Larkspur Landing are going to get new signage, and this is just as exciting as the bike racks. All signage will be in the style of MTC's regional transit hub signage initiative (PDF), meaning branding and stylistic consistency between Marin's major transportation hubs and those in San Francisco and the East Bay, putting our transit hubs on the same level as BART stations.

If the map suite will be the same as what we find in the East Bay (PDF), we can expect four displays. First is a station map, indicating what stops where. Though the Transit Center already has such a map, theirs is rather less intuitive or stylish than the MTC version. Second is the vicinity map, showing the streets, transit stops, and points of interest within a half-mile radius. These are typically found in kiosks in the City, and would be extremely useful down Fourth Street as well. Third is the local system map, showing where transit goes in about a two mile radius. Last is the service display, showing all services with fare information, timetables, transfer information, and the like. GGT wants to add a bicycle parking map, which will be in MTC's style though will be locally produced.

The drawback is that it seems like these signs won’t have their own internal lighting. The design documents show nothing about internal lighting or electrical systems. For those who are hard of seeing, this might be problematic. The Transit Center's internally-lit ad kiosks look great, and it's shameful that it's easier to see that you should buy Chanel than it is to see how to get home.

History and Cost

The project has been in the works since at least 2009 when the Bridge District applied for $245,000 in federal highway money through MTC. A $40,000 project was approved, but the project didn't get going until this year. Costs will be covered by FHWA if, of course, the bids that come in are acceptable, and that’s not a sure thing.

This is a move in the right direction for GGT. MTC has called on the agency to upgrade its signage and wayfinding to be in line with regional standards. Given the mediocre stuff currently on display – not to mention the moldy and cheap printouts you can find on display – this will move GGT out of the 1980s. Indeed, for the Transit Center it has been six years since MTC pushed GGT for change (PDF), so it's great to see the agency finally taking signage seriously.

With more people riding bicycles for everyday transportation, too, more racks will mean better transit access, and more parking, for those that need it. Bicycle use is exploding across the country, including Marin. By adapting to the times, GGT makes its transit infrastructure more flexible for the whole county.

Height Isn't Density

Courtesy of Google Much noise has been made over the height of the Civic Center Station Area Plan (SAP). Quiet and Safe San Rafael (QSSR) has called it “very high density”, citing increases to the unit-per-acre arrangement as proof. But density is not height, and height doesn't mean density.

I wrote about the relative densities of various properties around Marin about a year ago when it seemed the whole county was up in arms over ABAG's affordable housing requirements and density. Though my point then was that we already have “high density” housing in some decidedly low-density areas (30 units per acre on San Anselmo's Forbes Avenue, 20 units per acre in Novato, etc.), what wasn't mentioned was the relationship between height and density.

In short, it's a loose connection, and it's easy to see how. Three story houses in a subdivision are 4-10 units per acre. Three story rowhomes, however, could be 20-45 units per acre, and three story apartment buildings could go even higher thanks to the small size of studio apartments. We typically don't think like this when discussing density and height, but it's important to keep in mind as we continue the great debate over the form we want Marin's redeveloping communities to take.

The Civic Center SAP recognizes this and calls for raising the cap of units to somewhere above 44 units per acre.  This is a good thing, as 44 units is far below what a five-story apartment building could actually hold. Without this increase, which QSSR wants scrapped, the plan wouldn’t maximize residential density. Instead, the plan would maximize office density. From one standpoint, this would make a great deal of sense. Studies on the subject* show people are willing to walk further between home and transit than between work and transit. Given that SMART is designed to be a commuter rail line, putting offices right next to the train station is sensible.

But when planning how to shape development in San Rafael, this doesn't make any sense. Office rents in Marin are fairly low and the vacancy rate is unacceptably high. Until BioMarin decided to take up a chunk of the Marin Corporate Center, San Rafael's office market had a 25% vacancy rate. Contrast this with San Rafael's rental market, which is positively on fire. The vacancy rate is extremely low and rents are even higher than in almost as high as San Francisco itself. If San Rafael wants to maximize something, let it be in housing rather than offices.

If we wanted to top the area out at 44 units per acre, we should implement a form-based zoning code like the one in the Downtown SAP, but with a height limit of 36 feet and no density limits. This would have allowed developers to get the most out of the building they're permitted to build. Though office development would have been stymied, that's okay. When limits are lifted in highly constrained markets like Marin, developers tend to build small units like studio apartments, which attracts young singles, which attracts companies that employ young singles, which increases demand for office space and improves the office market in general.

The density limit currently in place also limits the effectiveness of inclusionary zoning laws, which force developers to set aside a certain percentage of units to be affordable. To keep the project viable, a developer needs to have enough housing to offset the costs of those affordable units, but when its hands are tied with a density limit often a project is just nonviable and is never proposed.

By adding 12-24 feet to the height limit while calling for increasing the density limit, the SAP will boost the availability of smaller units to address the problems just described. If the city council lifts the density limit entirely, it will go a long way to improve the office market, satisfy housing demand, and meet affordable housing requirements. The QSSR idea to maintain the density limit and the height limit would do nothing to meet any of these ongoing issues.

When San Rafael goes to do the investigations called for in the SAP, it needs to figure out what it wants and zone for that. If it creates a compromise where heights are increased but density limits are maintained, it will create a zone that works against itself and the economic interests of the county. When it finally does zone, it must keep in mind a form-based code.

*The clearest measure is on page 43 of this presentation (PDF) by G.B. Arrington, which shows a sharper drop-off in transit usage as jobs get further away from a station than the drop-off when housing gets further away from transit. However, if you're a stickler for studies, UC Berkeley found evidence (PDF) to back up the claim.

EDIT: The Civic Center SAP proposes investigating densities above 44 units per acre rather than setting a cap at 44 units per acre. The article has been changed to reflect the correction.

#NorthBayTransit Picks Up the Slack

I’ve publically berated Golden Gate Transit for ignoring its Twitter accounts, leaving riders in the dark about service changes, enhancements, bus bridges, late buses, full ferries, and everything else a rider needs to know.  Sonoma County Transit is worse, as it has no social media presence whatsoever. Well, it’s time to change that. As of last week, #NorthBayTransit will fill the gap for transit users in Sonoma and Marin. Schedule changes, stop changes, announcements, and all the rest will have this hashtag attached. It will transcend operator, so all eight transit agencies in the region (nine if you count GGT’s buses and ferries separately, ten if you include SMART) will have a one-stop-shop for all transit information.

The idea was birthed on Twitter with @mikesonn, while we complained about GGT’s press release-heavy communication style. Why not also tweet a brief description and a link? He asked that I keep him in the loop about what was happening, and I wondered whether I should keep everyone in the loop. The easiest way to keep tweets on a subject is a hashtag, and #NorthBayTransit was born.

Since I’m not on the ground in the North Bay, he offered to keep an eye out for unannounced changes in San Francisco. John Murphy (@murphstahoe) will tweet about issues in Sonoma. Meanwhile, I’ll get out whatever I can whenever I see it and push transit agencies to adopt the hashtag.

But we can’t do this on our own. We need your help to keep the feed up to date and active. If you see a problem, get bumped from a ferry, or have news to share, tag it. Retweet the agency feeds when they actually write something and tag those, too. @caltrain, a Twitter account updated by users, only works as well as it does because of the dedication of riders. You, the North Bay’s transit ridership, are the key to success.

I’ll see you on Twitter.

#NorthBayTransit

Street Greenery is Better than Thought

As it turns out, street greenery is even better at reducing pollution than thought. The research that I had found for last week's post showed greenery can filter out some of the worst particles but only up to 8% of the total pollutant plume. New research just released shows that green walls, when employed in an "urban canyon" environment, can filter out up to 60% of the particulate matter in diesel pollution. That, coincidentally, will include the SMART train. The urban canyon environment is when buildings go up on either side of the street and form single walls interrupted only by cross-streets. San Rafael's Fourth Street is a good example of this in Marin, and San Francisco's Market Street is a superb example in any context. These canyons create their own wind environments, circulating air up and then down and then up again in a vertical circulatory pattern.

Green walls are either plants growing out of the wall, like vertical gardens, or plants growing down walls, like ivy from planter boxes or wisteria from the ground. If these walls line a part of the urban canyon, the wind patterns will run polluted air through leaves multiple times, allowing the air to be filtered again and again.

Cities should actively encourage green walls to capture this effect, and SMART should plan for it where trains will run through residential areas. In places where buildings may rise above the freeway, as in the Downtown San Rafael Station Area Plan, green walls could be especially helpful in filtering the worst part of the air. Any investment in greenery for health reasons will be best put here. Similarly, where the freeway runs at ground level, ivy should be encouraged to grow on the sound walls.

As an added bonus, greenery cuts down on urban noise. Given how loud both the freeway is and the SMART train will be, encouraging leafy walls will be able to make our city streets that much more livable.

Investing in greenery is the single most cost-effective way to reduce pollutants and keep our cities healthy. With the new construction and higher-density zoning slated for areas up and down the 101 corridor, city councils and planning agencies need to take it seriously as more than just environmental greenwashing.